
02 / WEB & SOCIAL
Web & social mediaFrom analysisto stronger customer connections.
KINPASS analyzes your website, social media and YouTube to understand what you share and how customers reach it. We help decide what to change and, when useful, can take the next step with services such as video production.

01 / WHAT WE DO
What we can help with
What should you publish next?
Analyze what you already publish
We review views, traffic sources, video viewing and engagement across your website, social media and YouTube to see where customers discover you.
Review customer touchpoints
We check whether people can find the information you want them to see, then consider changes to content, channel roles and how visitors navigate.
Plan what to publish next
We can plan and film a video if it would help. After publication, we look at the response to decide what to change next.
02 / FROM DATA TO PEOPLE
Once we identify the problem, plan your next piece of content.
If a widely read page leaves questions unanswered, we work out what to add and where to share it. If a short video would explain it better, we can discuss planning and filming it.
Discuss video planning and filming →03 / KINPASS DEMO
How analysis can guide better content
KINPASS uses the analytics screens internally. Data visualization and reports can be discussed according to your needs.
The sample screens are in Japanese.
An example of KINPASS analysis 3 screensReview search, content and video performance
We review search, website and YouTube data to decide what to improve and what to publish next. These screens are used by KINPASS analysts.
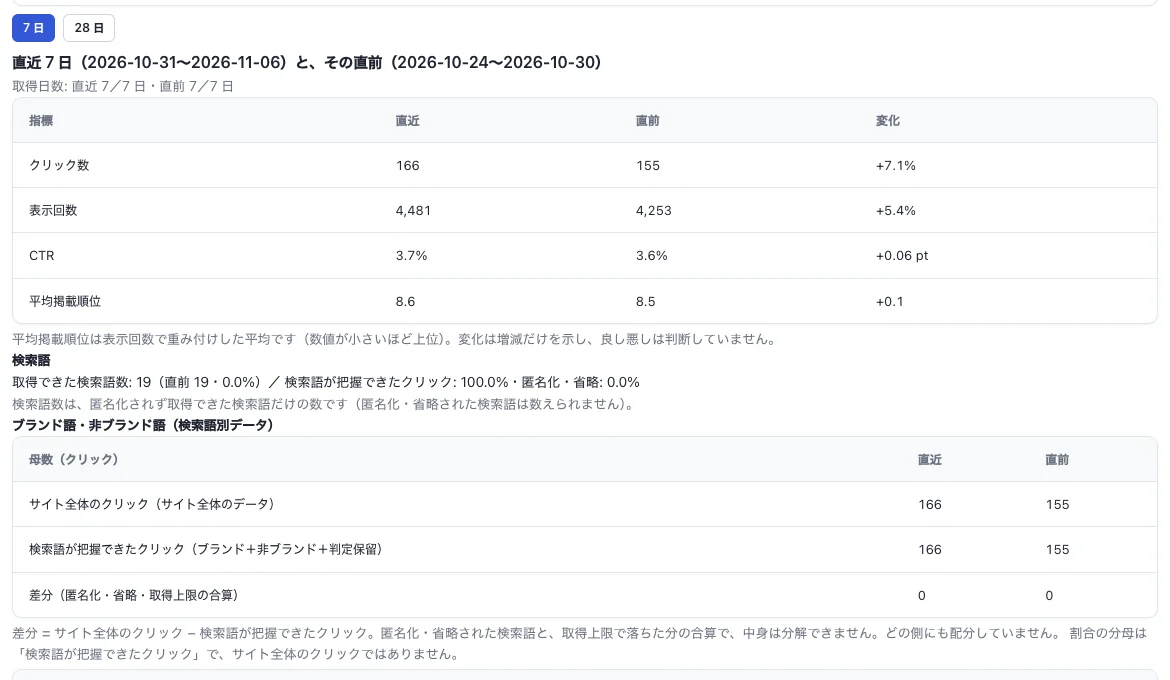
Check changes in clicks, impressions and ranking.
Demo environment and fictional data. The sample screens are in Japanese.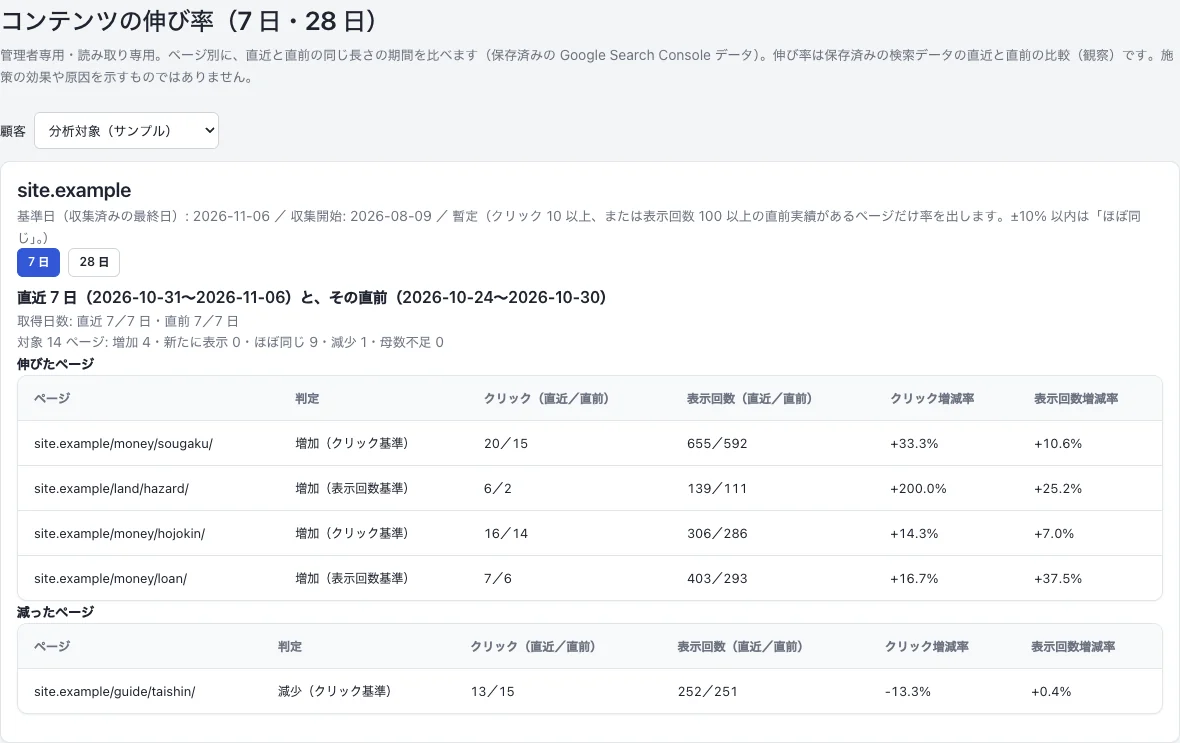
Decide which pages to update and how to build on content that is growing.
Demo environment and fictional data. The sample screens are in Japanese.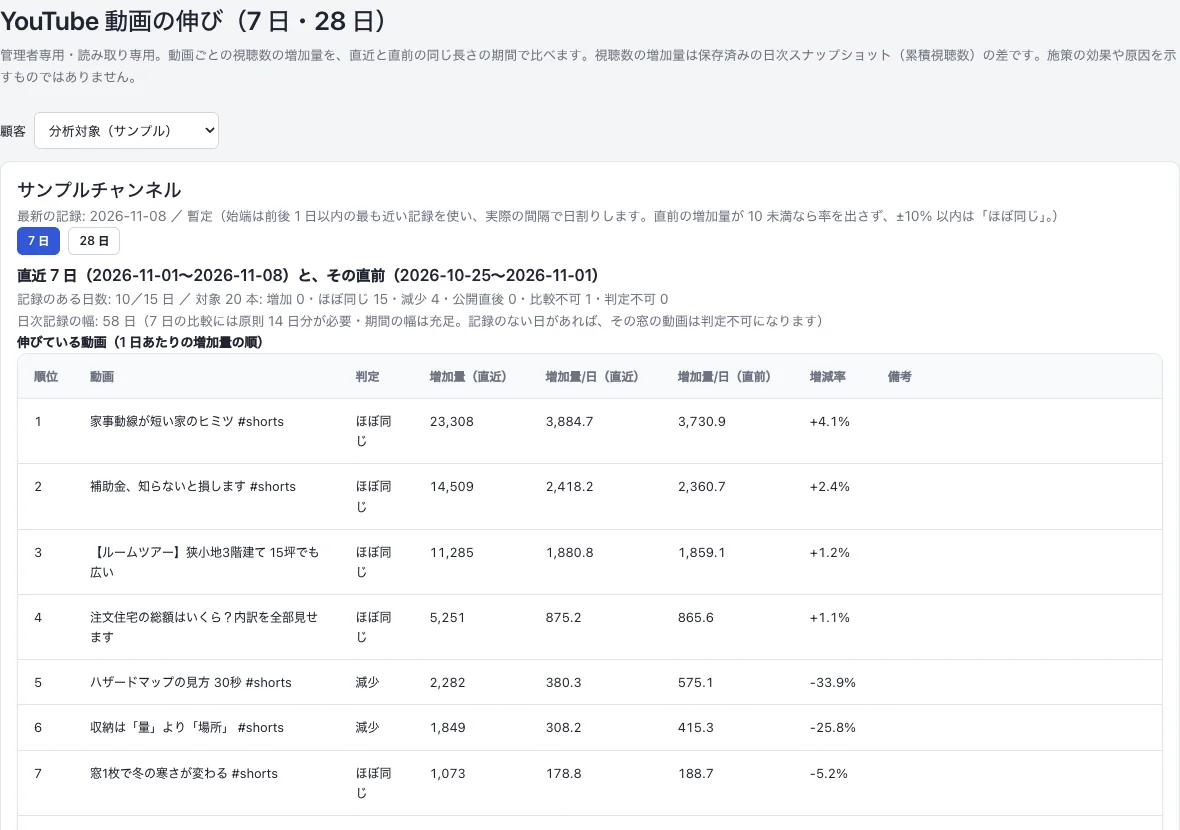
Compare videos that gained views with earlier videos to inform your next idea.
Demo environment and fictional data. The sample screens are in Japanese.An example of optional visualization OptionalKINPASS link map for Kintone
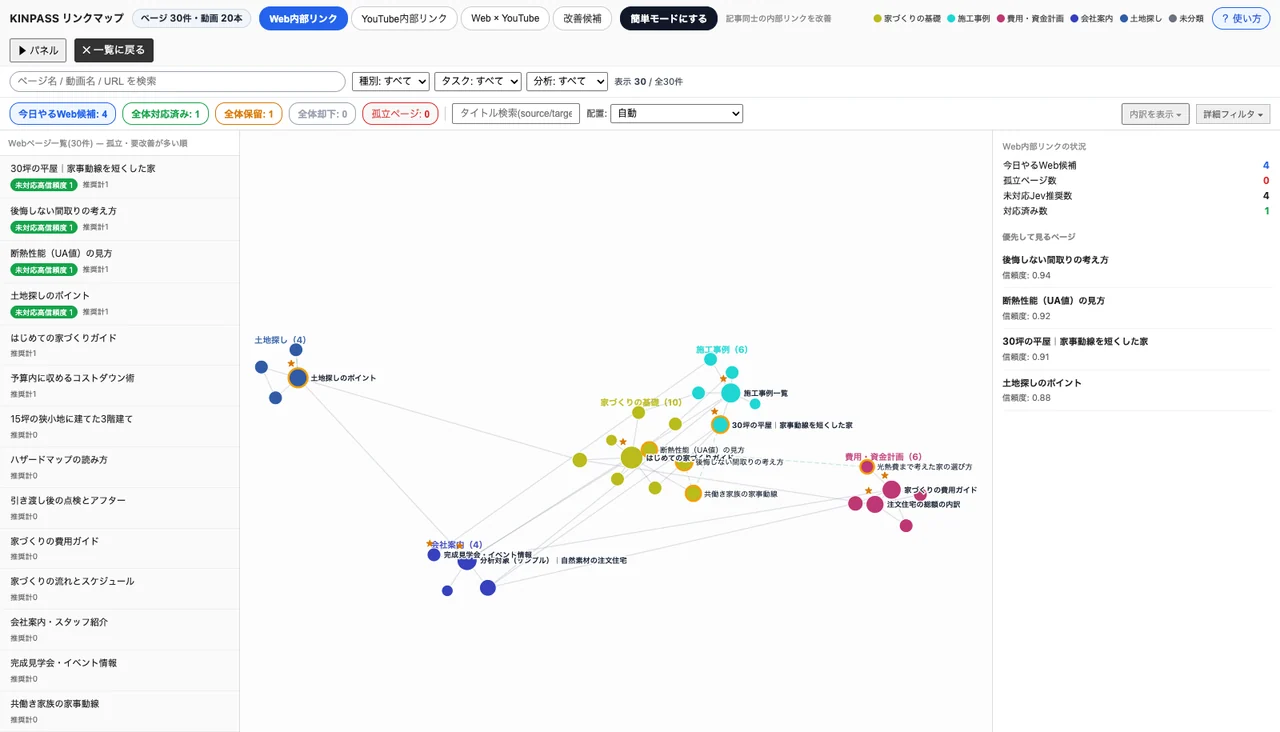
Where useful, we can use a link map in Kintone to explore how content is connected. Website articles and YouTube videos appear as nodes and their links as lines, helping us identify cross-channel paths and possible additions.
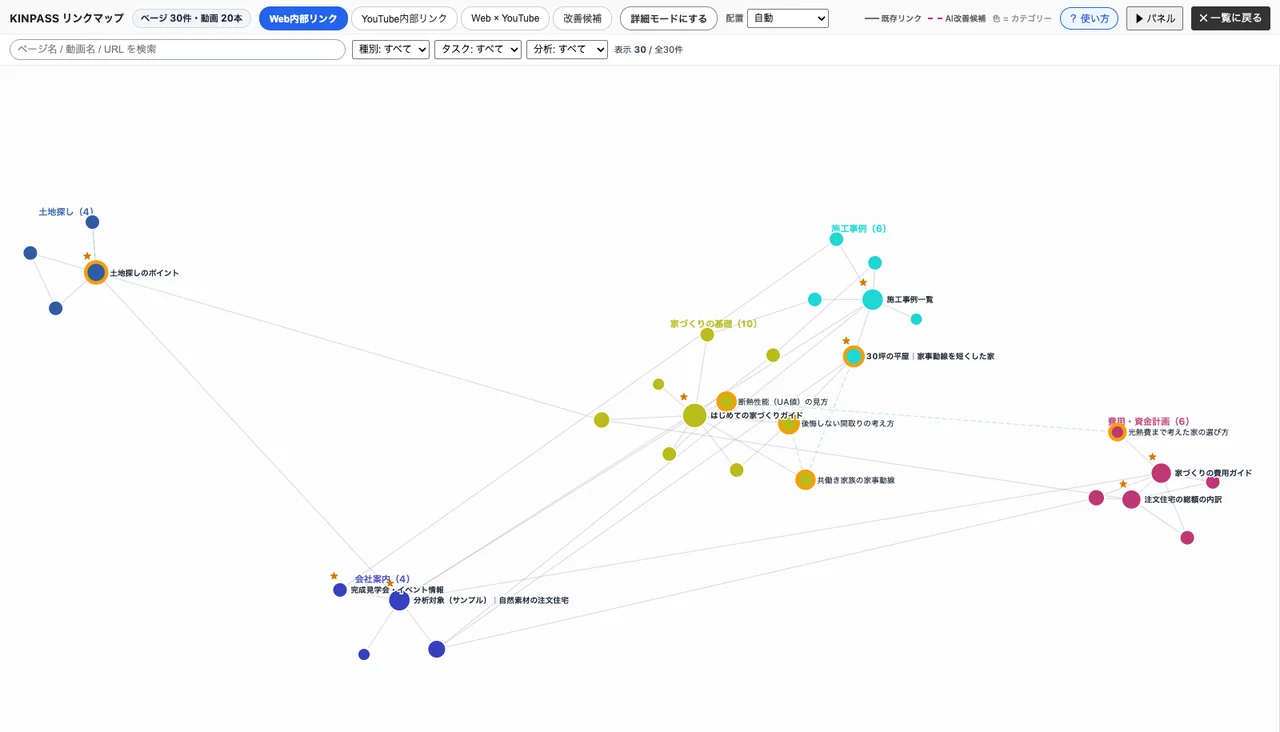
See how articles link to one another and find related pages.
Demo environment and fictional data. The sample screens are in Japanese.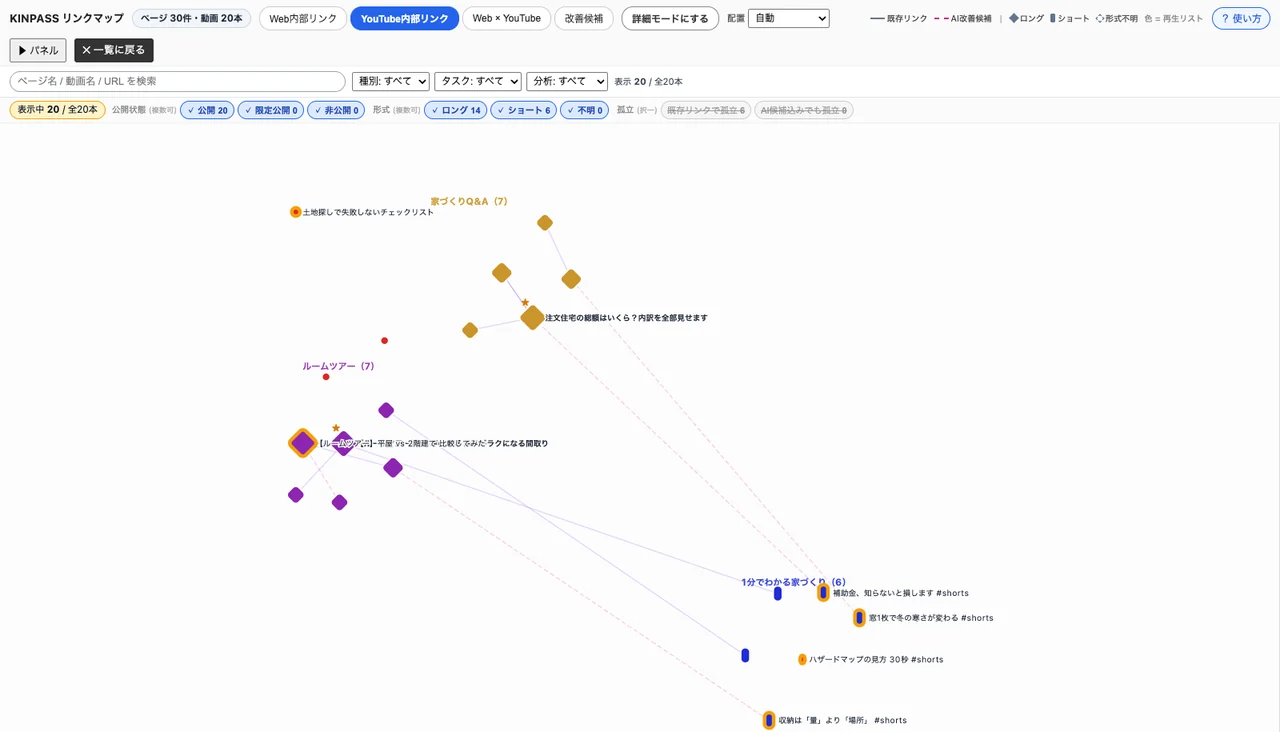
Find related videos you could link in YouTube descriptions.
Demo environment and fictional data. The sample screens are in Japanese.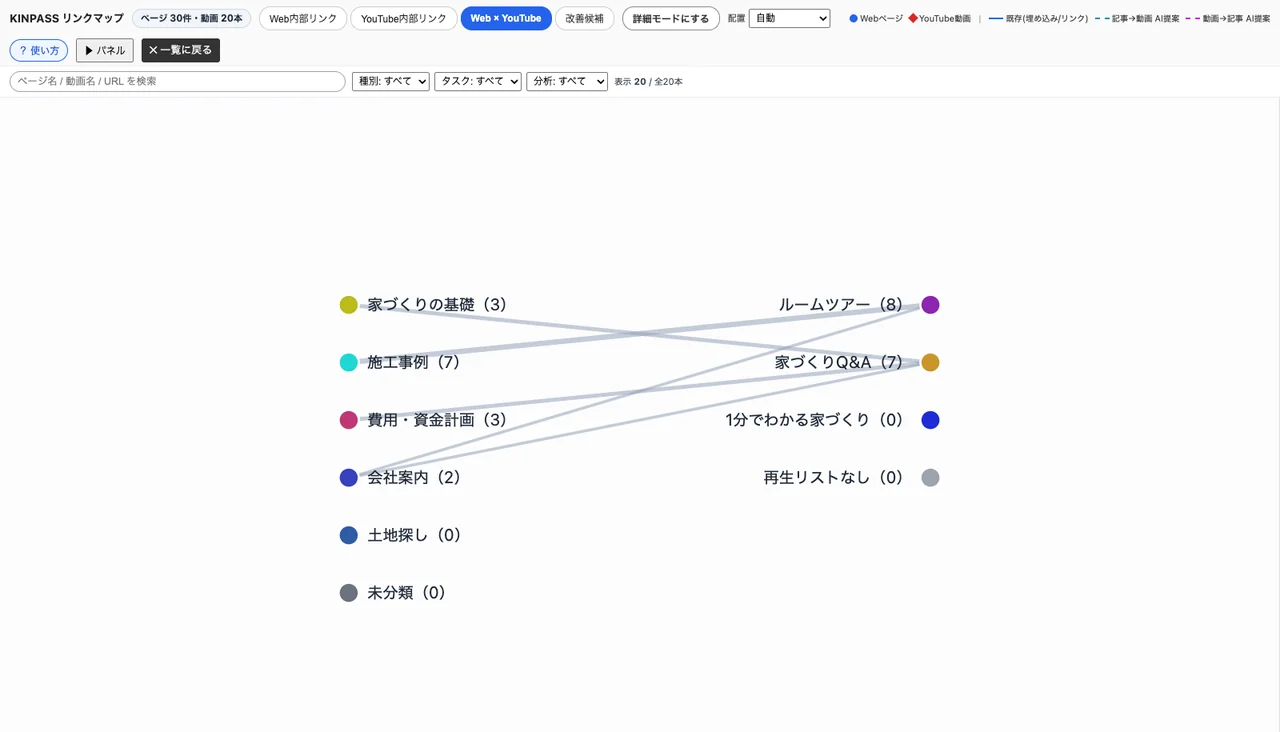
See how viewers can move between articles and videos on the same topic.
Demo environment and fictional data. The sample screens are in Japanese.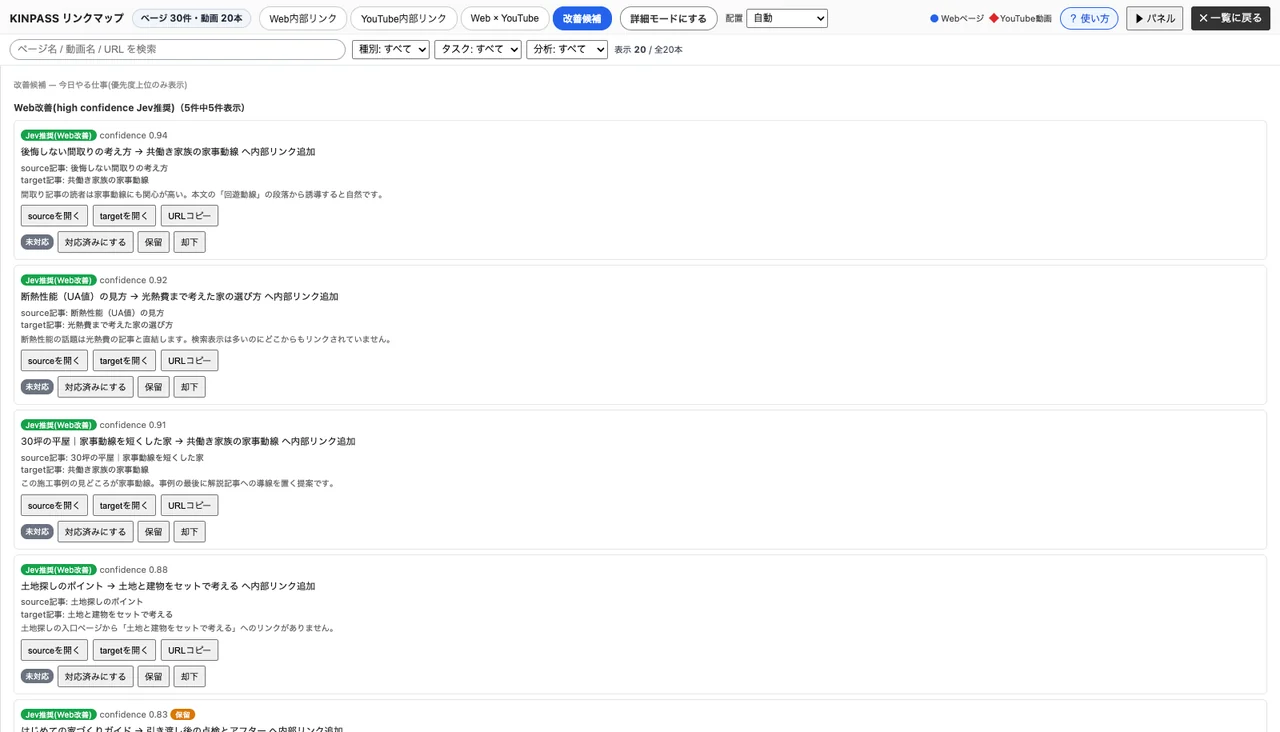
An example of an optional analysis report OptionalPDF reports according to the requested scope
Depending on the requested support, we can summarize analysis and possible improvements in a PDF report.
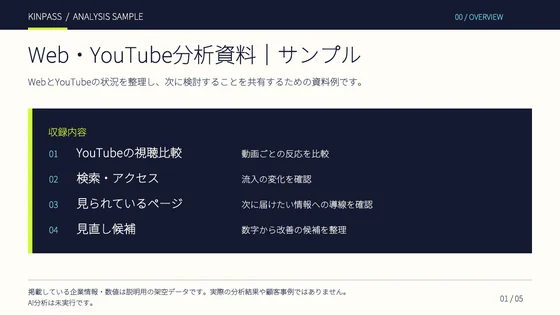
Sample analysis report
The organizations and figures shown are fictional. They do not represent customer cases or actual results. AI analysis has not been run.
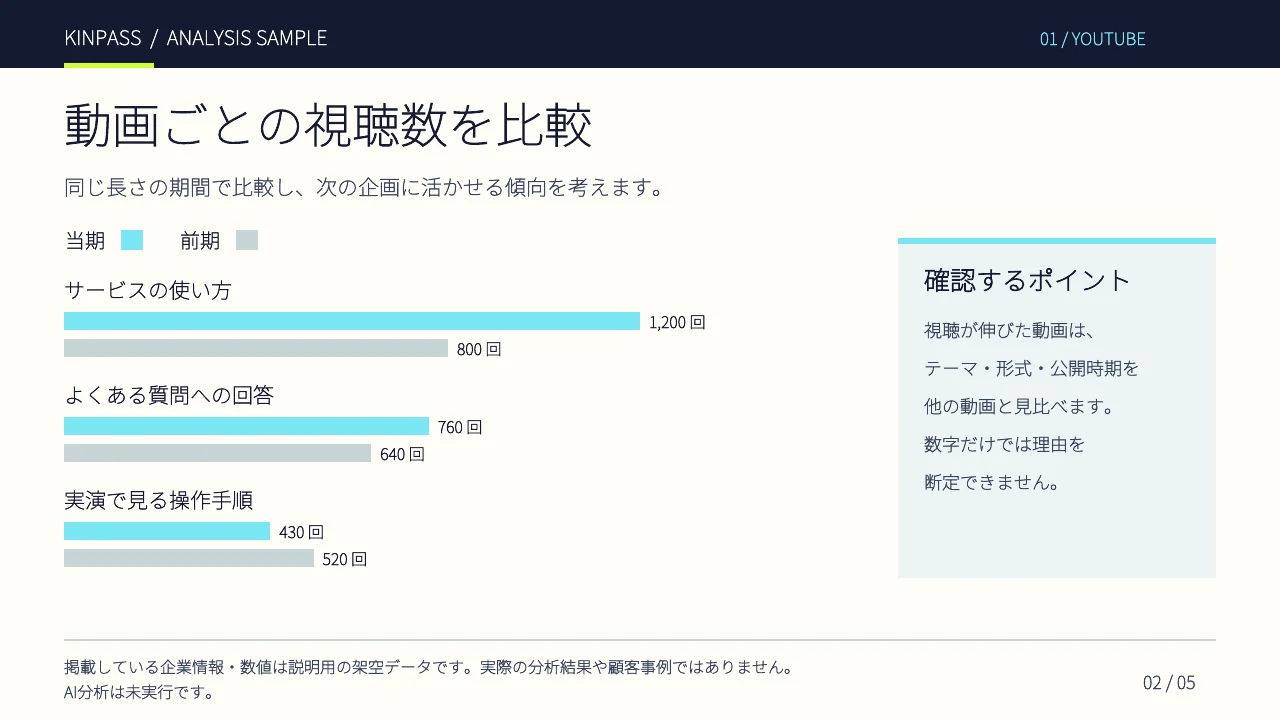
Report 2Compare views by video
Identify topics, formats and publication timing to consider for your next video.
Demo environment and fictional data. The sample screens are in Japanese.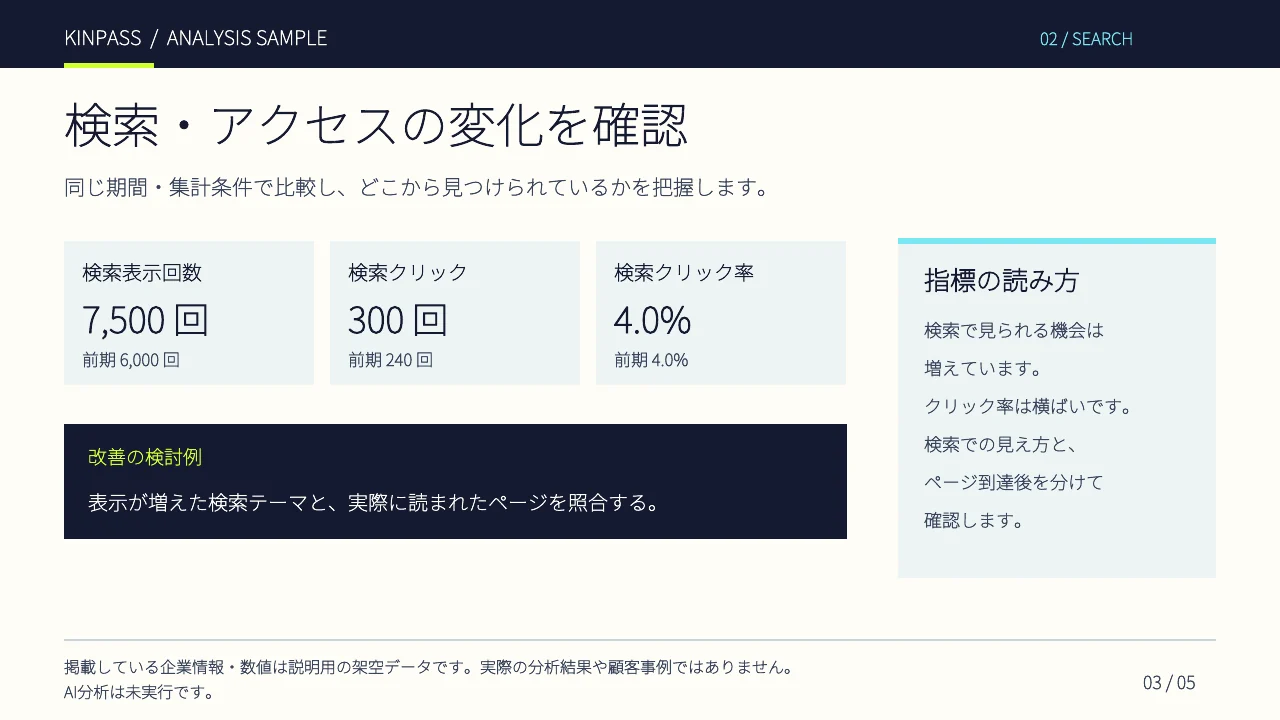
Report 3Changes in search and website traffic
Review how you appear in search separately from what happens after visitors arrive.
Demo environment and fictional data. The sample screens are in Japanese.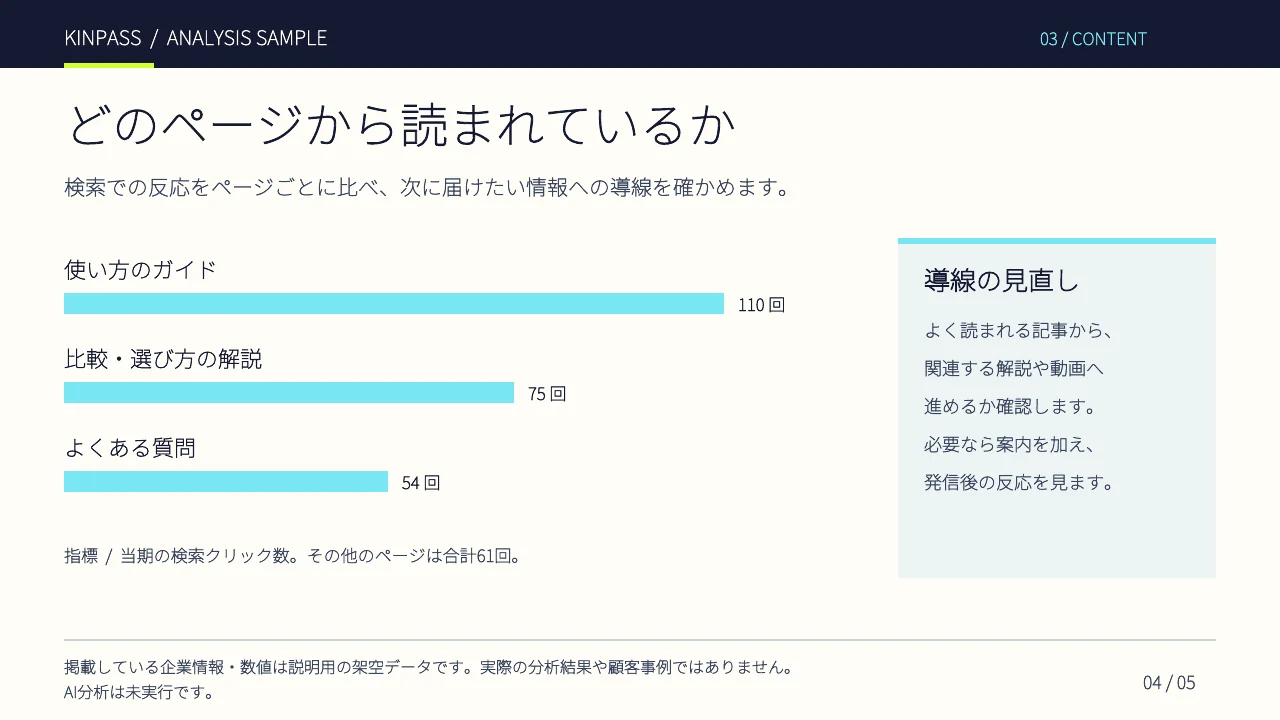
Report 4Which pages people arrive on
Consider how readers can get from popular pages to related guides or videos.
Demo environment and fictional data. The sample screens are in Japanese.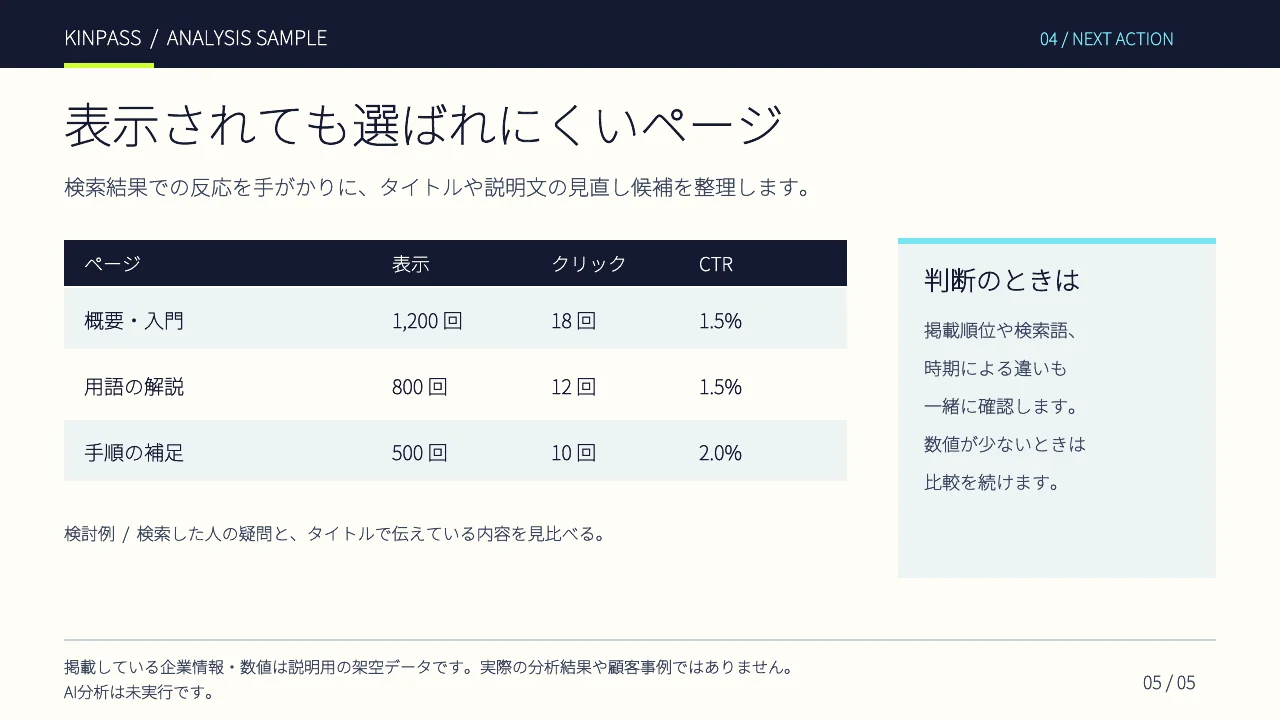
Report 5Pages that appear in search but attract few clicks
Check whether search titles and descriptions answer what users are looking for.
Demo environment and fictional data. The sample screens are in Japanese.We discuss available data, connection requirements and scope with you individually.
04 / INDIVIDUALLY SCOPED SUPPORT
Scope and pricing
We confirm the scope and provide a quote for additional support.
Advanced web and social media analysis
From ¥110,000 (including tax)
In-depth traffic and content analysis
We examine engagement and customer paths across web, social media and YouTube to find where people drop off and what to change in your content.
Training and custom support
Individual quote
We can help define procedures, responsibilities and approvals so your team can continue updating the website and publishing social media posts in-house. Training and materials are quoted separately.
Individual projects can include page changes, content production or posting needed to improve content and navigation.
05 / THE FLOW
How we work
We agree on which steps are needed for your situation.
- 01AnalyzeWeb, social media and YouTube
- 02Identify the problemCustomer touchpoints and paths
- 03Improve what you publishPlan content and make video if needed
- 04Check the responseUse findings for the next improvement
NEXT STEP / KINPASS
Make your next update count.
Start with your website or social media links and the issues you’ve noticed.
Start a conversation